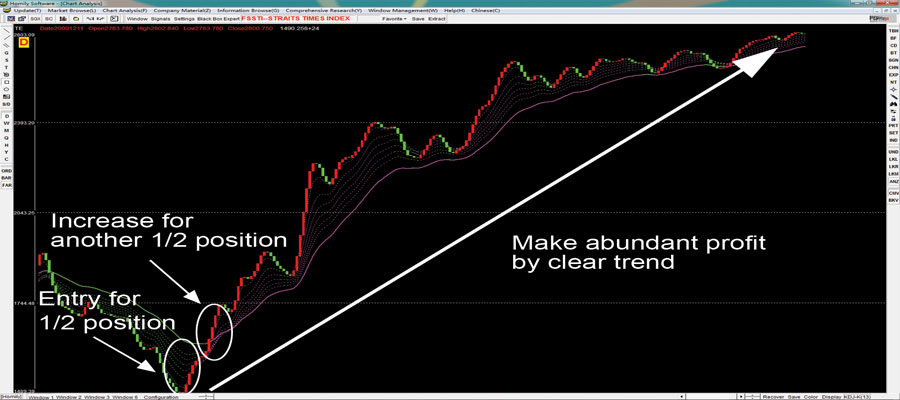
Trend Expert takes price trend as core, and reveals the basic direction of the trend. Don’t put all eggs in one basket. Position control and stop-loss can give you a big hand on the road to success in stock market.
Trend Expert takes price trend as core, and reveals the basic direction of the trend. Don’t put all eggs in one basket. Position control and stop-loss can give you a big hand on the road to success in stock market.
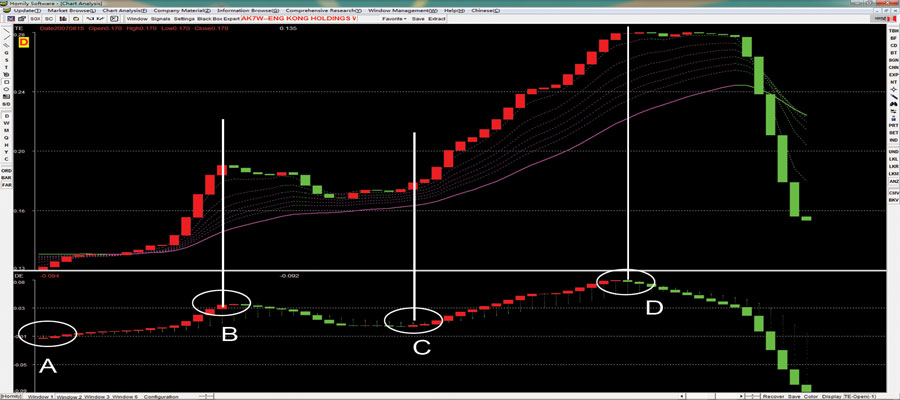
See the figure, A point in EngKong W091113 (AK7W), the column of Deviation Expert turns red, it indicates that the inflow of capital is greater than the outflow of capital.
At the same time, the Dow Candlestick of the Trend Expert subsequently turns red. The capital and trend combine well with each other. All of them indicate the stock comes into rising sharply. At B Point, the column of Deviation Expert turns green, it indicates that the outflow of capital is greater than the inflow of capital, meanwhile the Dow Candlestick turns green, we can decrease our position or even close the position in long position, and vice versa in short position. In later period, we can grasp the rising quotation by combining with the two private functions (from C to D).
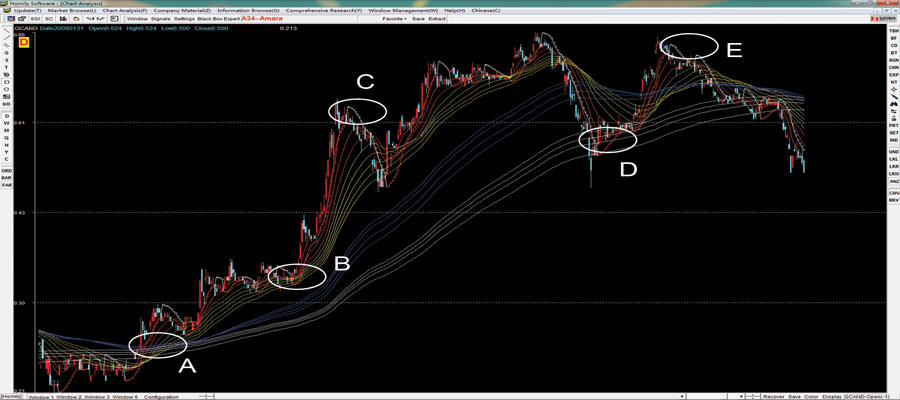
See the figure, A point in Amara(A34), it breaks up the concentration area of Homily Rainbow, the major trend will reverse, meanwhile, the white circle turns red, it is a buy signal. It will not be a sell signal until the red circle turns white. And the market still goes on with long arrangement, we can grasp precisely the two periods (BC DE) of rise quotation by combining with the two private functions.
Learning to invest rationally on one's own is the important step on the road to success. Homily Software is also the investors' friend, struggle against the changing stock market together.
Knowledge, tool and attitude are tje premise of investment success. Nevertheless, the required knowledge is not quite complicated. Gradually getting an insight into the market law is enough.

Securities technical analysis is not a method but a system. Stock investment, one kind og financial investment, is a specialized field.Homily Software takes Convenient as its main principle.